
Drive a native --chart from contrib JSON (chart-data=1, json=1) with --caption-left / --caption-right for the visible date range. Requires curl, jq, and the Terminal Widget CLI.
Script
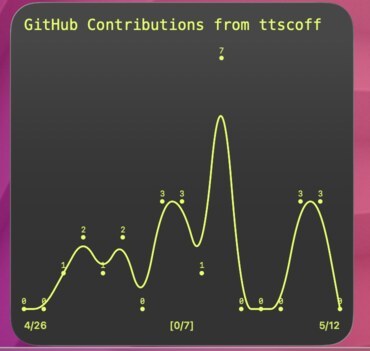
GitHub Contributions Chart (smooth + JSON)
Script (github-contributions-chart.sh)
#!/usr/bin/env bash
USERNAME="ttscoff"
CHART_FORMAT="smooth"
json=$(curl -SsL "https://brettterpstra.com/contrib/generate?username=${USERNAME}&chart-data=1&json=1&weeks=3")
startDate=$(echo "$json" | jq -r '.startDate / 1000 | strftime("%-m/%-d")')
endDate=$(echo "$json" | jq -r '.endDate / 1000 | strftime("%-m/%-d")')
user=$(echo "$json" | jq -r '.github.userLogin')
values=$(echo "$json" | jq -r '.values | join(",")')

/opt/homebrew/bin/terminal-widget --target github2 --chart "$values" --chart-format ${CHART_FORMAT} --font Menlo --bg 333333 --fg e0ff4f --caption --caption-left "$startDate" --caption-right "$endDate" --text "GitHub Contributions from $user" --annotate